
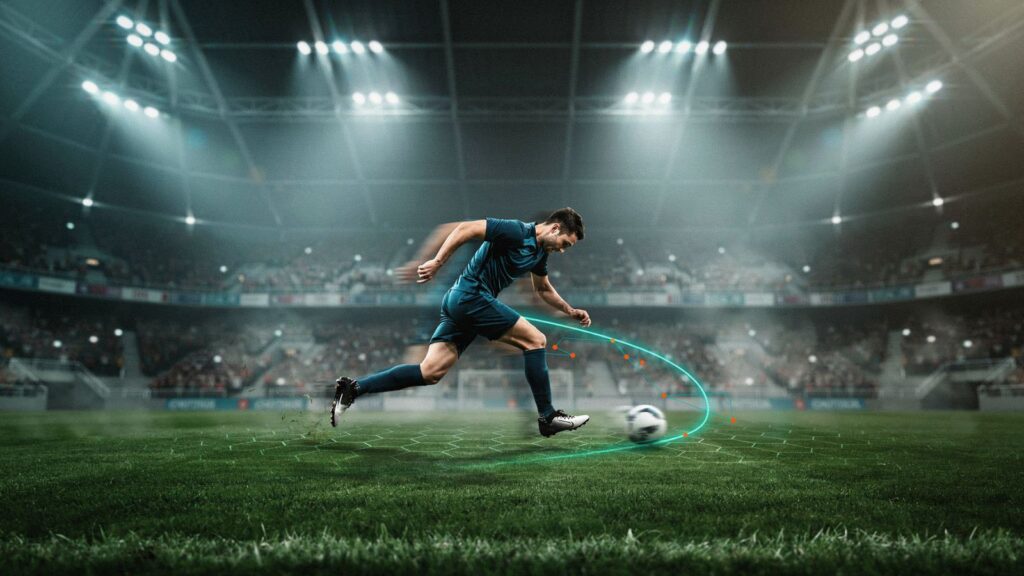
Behind every World Cup 2026 goal and tackle sits a staggering physical effort that rarely makes the highlight reel. FIFA’s official player-tracking data, alongside independent analysis from platforms like Sofascore, has turned this tournament into one of the most closely measured in history — recording exactly how far players run, how fast they sprint, and how much energy their bodies burn across a month of knockout football. The numbers reveal a sport that has quietly become one of the most demanding endurance tests in professional athletics.
Who Covered the Most Ground
Through the quarterfinal stage, FIFA’s official tracking data showed Spain’s holding midfielder Rodri leading the entire tournament in cumulative distance, having covered roughly 71 kilometres across his matches — the equivalent of nearly 1.7 marathons over the course of a month. Morocco’s Neil El Aynaoui sat close behind at around 70.5 kilometres, while also ranking among the tournament’s fastest players, a rare combination of volume and pace. Paraguay’s Andrés Cubas briefly topped the standings earlier in the tournament before his team’s elimination froze his total, illustrating a quirk of cumulative tables: they naturally favour players whose teams advance furthest and simply play more matches.
Individual match performances were equally striking. During Belgium’s group-stage win over Senegal, Youri Tielemans covered 15.1 kilometres in a single match, with teammate Timothy Castagne close behind at 14.7 kilometres — among the largest single-match distances recorded in the tournament. Rodri also led the field in high-speed running actions, with sprints and high-intensity efforts making up nearly a quarter of his total distance, reflecting a workload closer to a month of interval training than steady running.
How This Compares to the Established Science
These tournament figures align closely with decades of academic research on elite match play. Peer-reviewed analysis of World Cup-level football has found that top-level teams must collectively cover more than 100 kilometres per match to compete at the required intensity, with individual players regularly exceeding 10 kilometres. Central midfielders — the position that shuttles constantly between defence and attack — average around 11.7 kilometres per match, the highest of any position on the pitch, which explains why midfielders like Rodri, Tielemans, and El Aynaoui dominate the distance rankings. Research also shows that physical output during a tournament isn’t static: teams that progress through extra-time matches show measurably higher high-intensity running and sprint counts as the competition advances, a sign of players adapting to accumulated fatigue rather than simply slowing down.
The Calorie Cost of a World Cup Match
Translating this physical output into energy expenditure reveals just how demanding a single match is. Research from Liverpool John Moores University, using doubly labelled water — considered the most precise method available for measuring real-world energy expenditure — found that elite outfield players burn an average of roughly 3,566 calories across a week that included match days, while goalkeepers, whose physical demands differ substantially from outfield players, burn around 600 calories less over a comparable period. On matchday itself, research and sports federation guidance commonly cite elite male players burning approximately 1,500 calories during a single 90-minute match, with total daily energy needs during a congested tournament schedule climbing toward 3,700 to 4,000 calories once training, recovery, and basal metabolism are factored in.
This scale of energy expenditure explains why fuelling strategy is treated as seriously as tactics at this level. A player who fails to replace the carbohydrate and fluid lost across 90 minutes of high-intensity running risks a measurable drop in performance in the tournament’s most demanding moments — the same physiological principle that applies to any endurance athlete, just compressed into the stop-start intensity of a football match.
How This Data Is Actually Collected
The precision behind these numbers comes from a genuinely sophisticated tracking infrastructure. FIFA’s official system relies on 16 optical tracking cameras installed in every World Cup 2026 stadium, capturing up to 29 separate data points per player, 50 times every second. This camera-based approach falls under what the sport calls Electronic Performance and Tracking Systems (EPTS) — a category that also includes wearable GPS devices, and FIFA operates a formal Quality Programme that certifies both types of system against recognized accuracy benchmarks before their data can be trusted for official use.
Some national federations layer their own tracking on top of FIFA’s official feed. England’s performance staff, for instance, deployed a live GPS vest system at this tournament — worn underneath the playing kit, as permitted under the Laws of the Game once a device is certified as safe and non-dangerous — giving their coaching team a real-time dashboard during matches tracking high-speed running distance, sprint counts, acceleration and deceleration load, and heart rate. Whether captured by camera or by wearable sensor, the underlying goal is the same: turning what used to be a coach’s subjective impression of a player’s workload into objective, continuously measured data that can inform substitutions, training load, and recovery planning in real time.
Position Shapes the Physical Demand
- Midfielders: The highest total distance and most consistent workload, driven by the need to link defence and attack across the full width and length of the pitch.
- Wingers and full-backs: The highest concentration of maximum-speed sprints, frequently repeating explosive attacking and recovery runs down the flanks.
- Central defenders: Lower total distance but high-intensity actions concentrated into short, decisive duels and recovery sprints.
- Goalkeepers: The lowest overall distance and energy expenditure of any position, though with its own demands in explosive jumping, diving, and short sprints.
How Demands Shift as the Tournament Progresses
One of the more revealing patterns in the tracking data is that physical output isn’t constant across a tournament — it climbs. Research on knockout-stage football consistently finds that teams progressing through extra-time matches show measurably higher high-intensity running and sprint counts in later rounds compared to the group stage, even though fatigue is accumulating. This isn’t simply players running more for its own sake; it reflects the increased stakes and tactical intensity of knockout football, where every sprint and recovery run carries more weight than an equivalent effort in an early group match. It also means the players still active in the tournament’s final weeks — the ones dominating cumulative distance tables like Rodri’s — are absorbing their heaviest physical loads precisely when recovery time between matches is often shortest.
What This Means for Everyday Athletes
While few of us will ever approach a World Cup midfielder’s workload, the underlying principles scale down directly to recreational and amateur football. Matching your fuelling and hydration to your actual output, building the aerobic base that lets you sustain repeated high-intensity efforts, and respecting the accumulated fatigue of a demanding match or tournament are all lessons any serious player — from weekend leagues to national teams — can take directly from the data emerging out of World Cup 2026.
Sources
- World Cup 2026: Who Ran Fastest and Furthest? — Sofascore
- Analysis of Cover Distance During Official International Matches Based on Playing Position — Trakia Journal of Sciences
- Energy Expenditure of Elite Footballers — Barça Innovation Hub, citing Close & Morton, Liverpool John Moores University
- Distance Covered and High-Intensity Running Across Extra-Time World Cup Matches — PMC/NCBI
- FIFA World Cup 2026: The Tech Behind the Tournament’s Tracking Systems — TechRound
- England Deploys Live GPS Tracking at FIFA World Cup 2026 — Sports Video Group
The information in this article is for educational purposes only.